Mobile Phone Brand Preferences in Mathabhanga : Welcome to my website! I am Jyotirmay Banik, a student of Master of Business Administration (MBA) with a keen interest in consumer behaviour and market research. This platform showcases my independent academic projects, research work, and practical learning experiences.
This particular study explores mobile phone brand preferences and customer buying behaviour in Mathabhanga. The objective of the research was to understand how consumers make purchasing decisions when selecting a smartphone. The study focuses on key factors such as price sensitivity, product features, brand perception, performance expectations, and customer satisfaction.
The research was conducted using both primary and secondary data. Primary data was collected through a structured questionnaire distributed among local respondents, while secondary data was gathered from websites, articles, and industry-related sources. The findings provide valuable insights into local consumer trends, preferences, and decision-making patterns.
⚠️ Disclaimer:
This project is an independent academic study created solely for learning and educational purposes. The research is based on responses from 29 participants, which represents a limitation of the study. Therefore, the findings may not fully reflect the views of the entire population.
Mobile Phone Brand Preferences in Mathabhanga (Download the Full Project Report): Click Here
Interested in real-world insights? Click here to view the case studies
How Meesho Became Profitable Selling Low-Cost Products: Click Here
Analysis of Mobile Phone Brand Preferences in Mathabhanga and Customer Buying Behaviour
The mobile phone industry in India has grown very fast in recent years. With the availability of affordable smartphones and internet services, mobile phones are now used by people of all age groups. India has become one of the largest mobile phone markets in the world.
Smartphones play an important role in daily life. People use them for calling, messaging, online classes, social media, banking, shopping, entertainment, and business work. For many people, a smartphone is not a luxury but a basic necessity.
Brand preference is important because customers trust certain brands more than others. Factors like price, features, quality, camera, battery life, and after-sales service influence customers while choosing a mobile phone. A strong brand creates confidence and satisfaction among customers.
In small towns like Mathabhanga, the mobile phone market is also growing steadily. Customers mostly prefer budget and mid-range smartphones that offer good features at reasonable prices. Studying brand preference and buying behavior in such towns helps to understand customer needs and market trends at the local level.
Statement of the Problem
In today’s competitive Indian mobile phone market, many brands are available with different prices and features. Customers often feel confused while choosing the right mobile phone. When a customer visits a mobile shop, it becomes important for the shopkeeper to understand the customer’s preferences, such as preferred brand, price range, and important features.
If the shopkeeper or mobile company does not understand why a customer may reject a particular phone or which brand the customer likes the most, it can lead to dissatisfaction. By understanding customer brand preference and buying behavior, shopkeepers and companies can suggest suitable phones, improve customer satisfaction, and increase sales. This study focuses on identifying these factors among customers in Mathabhanga.
Objectives of the Study
- To study the mobile phone brand preferences of customers in Mathabhanga.
- To analyze the buying behavior of customers while purchasing mobile phones.
- To identify the key factors influencing purchase decisions, such as price, brand, features, and satisfaction level.
- To understand the price sensitivity of customers while buying mobile phones.
- To identify the most preferred mobile phone features, such as camera quality, battery life, brand value, and other technical features.
- To study the brand switching intentions of customers for future mobile phone purchases.
Research Methodology
Research methodology explains how the study was conducted and how the data was collected and analyzed.
a) Research Design
The research design used for this study is descriptive research.
This type of research is used to describe the preferences and buying behavior of mobile phone users in Mathabhanga.
b) Data Collection Method
The study is based on both primary and secondary data.
- Primary Data:
Primary data was collected through a structured questionnaire prepared using Google Forms and circulated among mobile phone users. - Secondary Data:
Secondary data was collected from the internet, articles, reports, and websites related to the mobile phone industry.
c) Sample Size
The sample size of the study consists of 29 respondents from Mathabhanga.
d) Sampling Method
The sampling method used for this study is convenience sampling, as the data was collected from respondents who were easily available.
e) Tools Used for Data Analysis
The following tools were used for analyzing the data:
- Percentage analysis
- Bar charts
- Pie charts
Data Analysis and Interpretation
The data for this study was collected from 29 respondents using a structured questionnaire. The data has been analyzed using tables, percentage analysis, and charts to understand the mobile phone brand preferences and buying behavior of customers in Mathabhanga
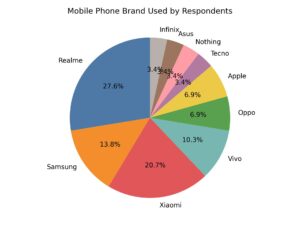
1.Mobile Phone Brand Used by Respondents
Table: Mobile Brand Used
| Mobile Brand | No. of Respondents |
| Realme | 8 |
| Samsung | 4 |
| Xiaomi | 6 |
| Vivo | 3 |
| Oppo | 2 |
| Apple | 2 |
| Techno | 1 |
| Nothing | 1 |
| Asus | 1 |
| Infinix | 1 |
Interpretation:
The table shows that Realme is the most used brand, followed by Xiaomi and Samsung. This indicates that customers prefer affordable brands with good features, while premium brands like Apple have fewer users.
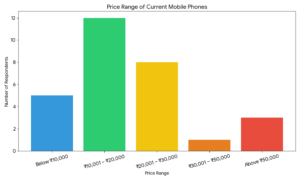
2.Price Range of Current Mobile Phone
Question: What is the price range of your current phone?
Table: Price Range Preference
| Price Range | Response |
| Below ₹10,000 | 5 |
| ₹10,001 – ₹20,000 | 12 |
| ₹20,001 – ₹30,000 | 8 |
| ₹30,001 – ₹50,000 | 1 |
| Above ₹50,000 | 3 |
Interpretation:
Most respondents use mobile phones priced between ₹10,001 and ₹20,000, followed by ₹20,001–₹30,000. This shows that customers in Mathabhanga prefer budget and mid-range smartphones.
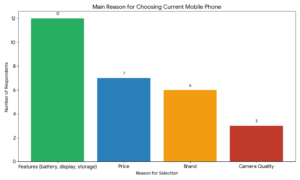
3.Reason for Choosing the Current Mobile Phone
Question: What is the main reason you chose this phone?
Table: Reason for Purchase
| Reason | Response |
| Price | 7 |
| Brand | 6 |
| Camera Quality | 3 |
| Features (battery, display, storage) | 12 |
Interpretation:
The most important reason for choosing a mobile phone is features, followed by price and brand. This shows that customers focus more on overall performance and usefulness rather than only brand name.
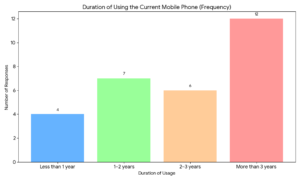
4.Duration of Using the Current Mobile Phone
Question: How long have you been using your current phone?
Table: Duration of Usage
| Duration | Response |
| Less than 1 year | 4 |
| 1–2 years | 7 |
| 2–3 years | 6 |
| More than 3 years | 12 |
Interpretation:
Most respondents have been using their phones for more than 3 years, followed by 1–2 years. This indicates that customers prefer to use their phones for a long time and expect durability and reliability.
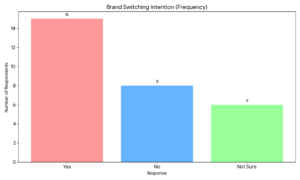
5.Brand Switching Intention
Question: Do you plan to switch to a different brand next time?
Table: Brand Switching Plan
| Response | No. of Respondents |
| Yes | 15 |
| No | 8 |
| Not Sure | 6 |
Interpretation:
A large number of respondents plan to switch to a different brand in the future. This shows that brand loyalty is low, and customers are open to trying better options.
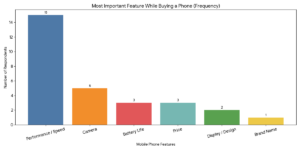
6. Most Important Feature While Buying a Phone
Question: Which feature is most important to you when buying a phone?
Table: Important Features
| Feature | Response |
| Performance / Speed | 15 |
| Camera | 5 |
| Battery Life | 3 |
| Price | 3 |
| Display / Design | 2 |
| Brand Name | 1 |
Interpretation:
Performance and speed is the most important feature for customers, followed by camera quality. This shows that users prefer phones that work fast and smoothly in daily use.
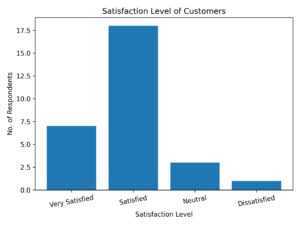
7.Satisfaction Level of Customers
Question: How satisfied are you with your current phone?
Table: Satisfaction Level
| Satisfaction Level | Response |
| Very Satisfied | 7 |
| Satisfied | 18 |
| Neutral | 3 |
| Dissatisfied | 1 |
Interpretation:
Most respondents are satisfied or very satisfied with their mobile phones. This indicates a high level of customer satisfaction with current mobile brands.
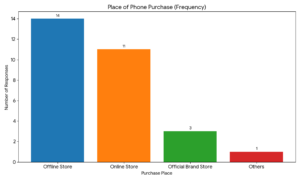
8.Place of Purchase
Question: Where did you purchase your phone?
Table: Place of Purchase
| Purchase Place | Response |
| Offline Store | 14 |
| Online Store (Amazon, Flipkart, etc.) | 11 |
| Official Brand Store | 3 |
| Others | 1 |
Interpretation:
Most respondents prefer buying phones from offline stores, followed by online platforms. This shows that customers still value personal interaction and trust, even though online shopping is growing.
Findings of the Study
- The majority of respondents prefer mobile phones in the ₹10,001–₹20,000 price range, followed by ₹20,001–₹30,000, showing a preference for budget and mid-range smartphones.
- Features and performance are the strongest factors influencing buying decisions, followed by price and brand name, indicating that customers focus more on overall usefulness than only brand image.
- Performance and speed is the most important feature for customers, followed by camera quality and battery life.
- Most respondents have been using their mobile phones for more than 3 years, showing that customers expect durability and long-term usage.
- A large number of respondents plan to switch brands in the future, which shows that brand loyalty is low in the mobile phone market.
- Offline stores are slightly more preferred than online stores in Mathabhanga, showing that customers still value personal interaction and trust, even though online purchasing is growing.
- The majority of respondents are satisfied or very satisfied with their current mobile phones, indicating a high level of customer satisfaction.
Suggestions
- Mobile phone companies should focus more on improving performance and speed, as this is the most important feature for customers.
- Brands should offer good quality smartphones in the ₹10,000–₹20,000 price range, as most customers prefer this segment.
- Camera quality and battery life should be improved, as these features strongly influence buying decisions.
- Mobile brands should provide better after-sales service to reduce brand switching and increase customer loyalty.
- Offline mobile stores in Mathabhanga should offer competitive prices and better guidance, as many customers still prefer buying from physical stores.
- Companies should use social media and local promotions to inform customers about new features and offers, as customers are open to switching brands.
Conclusion
This study analyzed the mobile phone brand preferences and buying behavior of customers in Mathabhanga. The results show that most respondents prefer budget and mid-range smartphones, especially in the ₹10,001–₹20,000 price range.
The study found that customers give more importance to performance, features, and price rather than only the brand name. Performance and speed were identified as the most important factors when choosing a mobile phone.
The findings also indicate that brand loyalty is relatively low, as many respondents are willing to switch brands in the future. Offline stores remain a popular place for purchasing mobile phones, although online shopping is gradually increasing.
Overall, most respondents reported being satisfied with their current mobile phones. The insights from this study may help retailers and mobile phone companies better understand customer needs and preferences in semi-urban areas like Mathabhanga.
Limitations of the Study
This study has certain limitations that should be considered when interpreting the results.
The research was conducted using a small sample size of 29 respondents. A larger sample could have provided more accurate and widely representative findings.
The study applied a convenience sampling method, which may limit the ability to generalize the results to the entire population.
The scope of the research was restricted to Mathabhanga. Therefore, the findings may not fully apply to other regions with different customer characteristics.
The data collected was based on self-reported responses from participants. As a result, the information may be influenced by individual opinions or biases.
In addition, the study reflects customer preferences and buying behavior at a specific point in time. Changes in technology, pricing, and market trends may affect future outcomes.
Despite these limitations, the study provides meaningful insights into mobile phone brand preferences and consumer buying behavior.